How do you know if your marketing strategy is working? By measuring the success of your marketing tactics against the goals you’ve set. Measurement uses metrics and key performance indicators (KPIs) to figure out how your efforts are impacting your business.
Measuring your marketing efforts is more than just figuring out how you’ll define success for your marketing campaigns. It involves using powerful marketing analytics tools that can help analyze your campaign data, figuring out what is actually getting visitors to buy, and making ongoing adjustments to your campaigns based on what you’ve learned about your customers.
Defining KPIs and Metrics
A KPI is a measurable value that shows how effectively you’re achieving specific key business objectives. An example of a KPI is cost per acquisition (CPA), which is the total cost of a particular campaign divided by number of conversions. Here are a few common KPIs you can measure:
Cart Abandonment Rate (CAR): This is exactly what it sounds like — how many visitors leave your site during checkout versus how many go through with their purchase. This lets you know if there's something in the checkout process that's turning off shoppers and making them leave, like limited payment options. You can calculate your cart abandonment rate with this formula: 1-[(# of completed transactions) / (# of shopping carts created with at least 1 item in the cart) x 100].
Bounce Rate: As the name implies, this KPI is a measurement how many people take the exit ramp off your website after viewing just one page. This is a good indicator of whether the page you’re leading traffic to is resonating with your target audience.
High bounce rates often indicate the visitor has had an unpleasant or irrelevant experience—in which case, you've got some optimizing to do. There are a few quick changes you can easily implement to reduce bounce rate. First, make sure the messaging and keywords from your ads, emails, and search terms match your destination landing page. Slow page load times can also increase bounce rates. Product pages that are not generating as much revenue probably lack pertinent information or appealing imagery.
Conversion Rate: This is the number of visitors that took the action you wanted (like making a purchase) divided by the total number of visitors to your website. Other conversions you could track include a free-trial signup, new account creation, download, newsletter signup, or a product demo. Calculating this number helps you measure how effective your messaging is, and how successful your content is at convincing your visitors to take an action.
Cost Per Acquisition (CPA): This is the total amount of money used on a set of ads divided by the number of completed actions attributed to an ad or campaign. You can use this measurement metric to understand the direct revenue impact of your marketing campaigns and figure out how much ROI each tactic is providing.
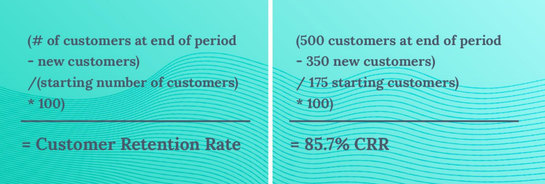
Customer Retention Rate: This is the percentage of customers you keep over a specific time period. To calculate, take the number of customers at the end of a period, like the end of the quarter, and subtract the number of new customers you acquired during the same period. That number is then divided by the number of customers you had at the start of the period and multiplied by 100. The formula would look like:
![]()
To spur growth, companies need to increase sales through a combination of new and repeat customers. Retention rate measurement can help you find opportunities to engage and upsell existing customers.
Return on Ad Spend (ROAS): This KPI tracks how much money you make for every dollar you spend on ads. A positive ROAS means that you’re making more than you’re spending on ads. This metric lets you know if your marketing is working — or not, depending on whether your ROAS is positive or negative.
![]()
Understanding Attribution Models
As marketers, it’s essential to learn how your customers interact with your brand before completing an action or making a purchase. Enter attribution.
Attribution is a method of marketing measurement that helps you determine which marketing touchpoints along the customer journey led to a conversion (ex: a purchase, download, or sign up).
An attribution model is a set of rules that determines how conversion credit across is assigned different marketing touchpoints. Attribution models typically fall into two categories: single and multi-touch attribution.
Single-Touch Attribution
Single-touch attribution models are the most commonly used attribution models in part because there is a low level of complexity and analytic tools like Google Ads and Google Analytics default to single-touch attribution models like last-click. These models assign 100% of conversion credit to one marketing touchpoint.
To help illustrate how each of these touchpoints are assigned different conversion credits depending on the model applied, we’ll be referencing this example:
Let’s say you sell studio-quality headphones online. Now let’s say that a customer sees a promoted ad on social but doesn’t click through. That same day, she finds your website by clicking one of your search ads. She goes to your site but doesn’t add any items to her cart. One week later, she comes back again, after seeing an ad with a pair of headphones she was looking at the week prior. Three hours later, she returns directly to your site and buys that same pair of headphones.
First-Touch: First-Touch attribution model assigns 100% of the conversion credit to the first impression that the user interacted before converting. In our example, the promoted social ad would receive all the conversion credit because it was the first marketing effort that initiated the customer’s journey.
Last-Touch: Last-Touch attribution is the exact opposite of first touch. This model gives 100% of the conversion credit to the last channel the customer interacted with before buying. In our case, the last interaction is when she went directly to your website.
First-Click: This attribution model is pretty straight forward. Here 100% of the conversion value is attributed to the marketing channel that the customer clicked before buying or converting.
Last-Click Attribution
Last-click assigns 100% of the credit to the marketing effort that a customer clicked before driving them to your website and converting.
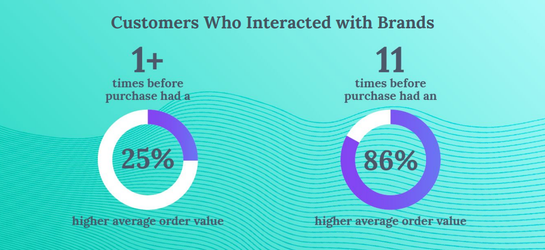
A study from digital marketing agency R.O.EYE found that customers had seven brand interactions before they made an "optimum" online sale. These customer interactions happened across multiple channels, including Google AdWords, affiliates, display ads, blogs and forums, email campaigns, Facebook, and direct traffic. The study also found that customers who interacted more than once with a brand before purchase had a 25% higher average order value, and customers who interacted with brands 11 times before purchase had an 86% higher average order value.
Multi-Touch Attribution
Rather than assigning all the credit only to that last click before purchase, attribution models take into account all the actions a visitor takes before purchasing, enabling brands to better understand their customers’ journey and optimize accordingly.
Linear: Linear attribution models distribute the credit evenly. While this is a step-up from the single-touch model because it doesn’t ignore any touchpoints, not all marketing efforts are created equal. This is a great model to understand all the marketing touchpoints along the conversion path.
U-Shaped: This model allocates 40% of the credit to the first and last touchpoint before the conversion. The other 20% of the credit is divided between the marketing touchpoints that happened in between.
W-Shaped: W-shaped attribution models assign 30% of credit to the first touchpoint, middle touchpoint, and last touchpoint. The remaining 10% is divided evenly to the touchpoints in between.
Time Decay: Time decay models assign credit across all your marketing touchpoints, but assumes that the closer the touchpoint is to the conversion, the more credit it should receive.
As a common practice, build your attribution model around your goals. Additionally, keep your lookback windows (a set period of time before your visitor bought something) in mind when applying credit. You’ll want to see the last 28 days of your campaigns so you can take into account all the touchpoints before deciding on a model. Think of attribution modeling as an ongoing measurement process to determine your marketing’s impact on your business so you can spend your marketing dollars most effectively.
Now that you know about measurement, let's go over how to craft a compelling brand story. Check out AdRoll’s Ultimate Guide to Growth for more.
Last updated on April 23rd, 2025.


