How do you know if your campaigns and initiatives are working? Having the right measurement tools and being able to attribute results to activities allows you to claim victory when you’re making a positive impact, and fix problems when they arise.
As you work through this section, think about how you evaluate the effectiveness of what you’re doing, and how you would like it evaluated by others.
Measuring Key Performance Indicators (KPIs)
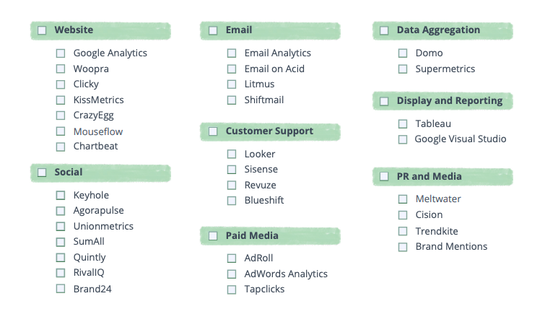
Now that you’ve set goals, objectives, and KPIs, you need some way of measuring them. The tools you use will depend largely on the platforms you use, the KPIs to measure, and your budget. Ideally, you will want to measure EVERYTHING. Even more, ideally, you will want to measure everything and bring it all together so that data from one platform or channel is matched to data from another. That isn’t always possible, especially for brands operating on a strict budget, but it should always be the goal. You should, at the very least, have the ability to count the people who come to your website and identify what actions they took. Here are some suggestions on additional analytics tools you may find useful.
Click the image below to download this checklist.
![]()
Attribution Modeling
Collecting data is great, but eventually, someone will ask you to make sense of it all. Linking initiatives to customer actions to business goals is the process of attribution. A deep dive into attribution may be beyond the scope of this workbook, but it’s important to at least familiarize yourself with the basic types of attribution models. Attribution models allow you to assign value to every touchpoint that your customer makes on their buyer journey, with different models giving different values to touchpoints based on proximity to a conversion or other criteria.
Terms to know:
Look-back window: The period of time before the conversion happens in which touchpoints are attributed to that conversion.
Touchpoint: Any interaction between a potential customer and your brand, whether it’s a click, a like, or a view.
Single-touch attribution model
This is the simplest type of attribution model and gives the full value of the conversion to a single touchpoint. Typically, this is the last touchpoint before a conversion, or the first one — this is why it’s often referred to as a last-click or first-click model.
Pros: This is the most straightforward model to use and understand. It rarely requires any specialized tools or software to measure and is often “right enough” for people just starting with data modeling.
Cons: The single-touch attribution model doesn’t give you any details on the customer journey. The average customer requires more than six touchpoints before buying something, and this model doesn’t credit any value to the other ones.
Linear attribution model
A linear attribution model is the simplest of the multitouch models and assigns an equal proportion of the conversion value to every touchpoint in the look-back window. Each touchpoint becomes worth exactly the same amount.
Pros: It captures all the touchpoints in the lookback window and gives values for all or most of your initiatives. Much more informative than single-touch.
Cons: It's overly simplistic. The weights are assigned equally for each step, and the model doesn't actually evaluate the importance of the step.
Time-Decay attribution model
The time-decay model gives the most value to the last touch, slightly less to the touch before it, a little less to the one before that, etc. Think of it as a staircase of value attribution.
Pros: More robust than single-touch, more accurate than linear attribution. Makes sense intuitively — it fits the common-sense model that touchpoints become less important as you go back in time.
Cons: Still more simplistic than the reality of the customer journey. Static values for each touchpoint may not weigh touchpoints with accuracy. Proximity is not necessarily equal to importance.
Dynamic attribution model
A dynamic attribution model uses algorithms or AI technology to assign weight to each touchpoint based on a series of calculations. This model uses historical data and other signals to constantly shift value attribution.
Pros: This is the most robust and intuitive of attribution models. It gives the difficult task of determining touchpoint value to a computer. Much more accurate than static models, it can change in response to customer behavior.
Cons: It can be difficult to implement. Often requires relatively expensive software and can be inaccurate if misconfigured.
![]()
Turning Growth Into More Growth
By monitoring your successes and improving on your failures, you can turn your initial growth into more and more growth. That requires understanding what success looks like, and knowing how to replicate it. It also requires having a structure for making those improvements.
You’ve launched a lot of initiatives by now, and collected and measured results. Now it’s time to evaluate and improve. Your marketing is the same way — a small change can mean big improvements, and a lot of small changes add up to a full digital transformation!
Are you interested in learning more about how to carve a place for your brand? Check out our interactive workbook, The Ultimate Guide to Building a Digital Brand, to understand how to differentiate your brand from the competition.
Last updated on April 23rd, 2025.


