Attribution consistently ranks as one of the most challenging parts of any marketer’s job. With so many channels to account for in today’s world, getting accurate information on which strategies are working and which are lagging can be frustrating. That’s why so many companies have turned to marketing attribution tools that can manage the process of tracking data from multiple channels. Among the best-known solutions is Google Analytics, which offers an array of useful tools for marketers looking to gauge ROI and optimize their ad spending.
In this article, we’ll review how to use attribution in Google Analytics, highlight key features and limitations, and discuss alternative solutions that marketers can use to collect valuable business insights from the buyer’s journey.
In this article:
Basics of Using Google Analytics for Attribution Measurement
Prepare Google Analytics for Attribution
Multi-Channel Funnels Reports
Attribution Beta
Google Analytics 360
Limitations of Google Analytics
AdRoll Cross-Channel Attribution
Take the Next Step With Attribution
Basics of Using Google Analytics for Attribution Measurement
In recent years, Google rolled out two features on its analytics platform to illuminate the performance of the different stages of conversion funnels. The first feature is "Multi-Channel Funnels" (MCF). More recently, the "Attribution" section was added as a separate tool that is currently available as a beta feature.
MCF provides companies with an overview of consumer behavior across various marketing channels. This information helps marketers understand how well each of the channels is performing — both individually and as a unit. The "Attribution" section uses attribution models to provide a high-level view of your marketing efforts at each touchpoint.
Prepare Google Analytics for Attribution
Before getting started, it’s important to prepare Google Analytics for attribution by adjusting the appropriate settings.
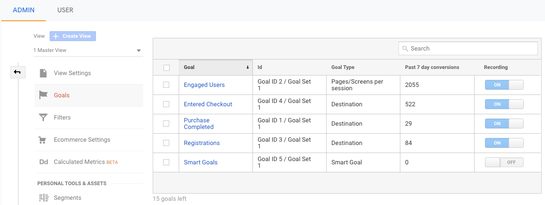
Define your goals
Defining your goals is an essential first step in attribution because it tells Google what to measure and how you define success. There are four types of goals, according to Google:
- Destination — when a specific location loads, like a "thank you" screen
- Duration — when a session lasts a certain amount of time (e.g., 10 minutes spent on a site)
- Pages/screens per session — when someone views a specific number of pages or screens
- Event — when an action (defined as an event) is triggered (e.g., video play, ad click)
![google analytics attribution image]()
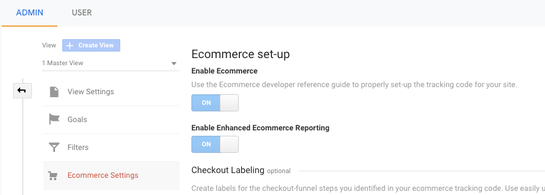
Enable e-commerce setup for e-commerce sites
Google enables you to track e-commerce data, like sales amount, number of orders, billing location, average order value, and more. To view this e-commerce data, you must first turn on the "Enable Ecommerce" and "Enable Enhanced Ecommerce Reporting" options. They are housed under the "Ecommerce Settings" section.
![]()
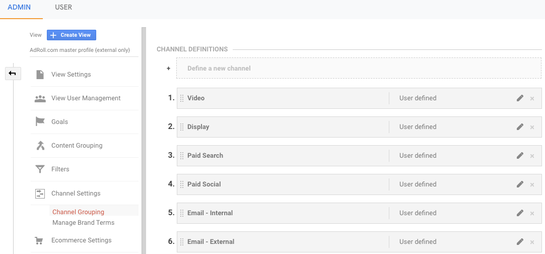
You can customize how your channels are viewed within Google Analytics using rule-based groupings of your traffic sources. Once you create a custom channel grouping or a new channel grouping, you will have the ability to:
- Select it in the reports section
- Apply it to historical data to review information through a new lens
- Change how reports display your data
Visit "Channel Settings" > "Channel Grouping" to see your options.
![]()
You can also edit the default channel grouping to permanently change how raw data is viewed in new sessions. However, this option will not apply to historical data, so the existing channel groupings will remain the same.
Multi-Channel Funnels Reports
Multi-channel funnels (MCF) provide a set of reports that help you visualize customer behavior and evaluate the impact of individual channels. It also offers some reporting functionality on “Assisted Conversions,” which are conversions that occur across several channels that work together. MCF is located under the "Conversions" section. Below are several key elements that you’ll need to know when you set up your MCF.
![google analytics attribution image]()
Conversions and Assisted Conversions
Most marketers understand the concept of conversions — the successful completion of actions that you want the user to take (e.g., click, watch, complete a form, purchase). "Assisted Conversions," which can be found under the MCF section, measures the indirect value of a particular channel. This analysis accurately reflects that touchpoints throughout the customer journey assist with the eventual conversion, even if they do not convert on their own.
The "Assisted Conversions" report shows how many sales and conversions can be attributed to or were assisted by each channel, including display ads, mobile ads, Search Ads 360, rich media ads, and click trackers. The report also displays the value of those conversions and the total revenue generated by the sales. The importance of a channel’s assist role is directly tied to the sales and conversion numbers.
Conversion paths
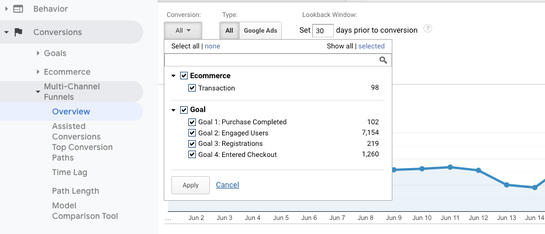
The conversion path describes a series of visits to your website that ultimately result in a conversion or sale. It has three primary elements: a lookback window, conversion, and nodes that represent each website visit.
The lookback window defines how many days prior to conversion Google will consider in its analysis. The default lookback window is set to 30 days. So, any visits beyond the 30-day cutoff will not be included in the report. Setting a limit to the amount of time that Google analyzes will help the results populate much quicker since it takes significantly more time and bandwidth to calculate two years worth of data versus two months.
Conversion — Define which conversion you want to track to get the best results for your goals and campaign. Unless you set this property, Google will calculate all of your conversion goals. This wide-ranging analysis may be thorough, but it is often not as useful as assessing a single goal or one group of goals at a time.
Nodes represent each visit that a consumer makes to your website. They populate from the first date in your lookback window to the point of conversion. The path length refers to the number of visits within the lookback window, while the time lag refers to the amount of time between the first and last visits. In other words, the amount of time it took a visitor to convert after their first interaction with your website.
Model comparison
The other articles in this series dive into greater detail about the attribution models. For the purposes of this discussion, here is a quick overview to refresh your memory.
Last-touch —100% of the credit is attributed to the last touchpoint that a customer interacted with before making a purchase.
First-touch — 100% of the credit is attributed to the first touchpoint that a customer interacted with, or how they became aware of the brand.
Linear multi-touch — Credit is spread evenly across all touchpoints in the customer’s journey.
Time decay — The last touchpoint prior to conversion gets the majority of the credit. The rest of the credit is assigned to the remaining touchpoints. The amount of credit assigned is inversely proportional to the distance from the conversion —the greater the distance, the smaller the credit. So, the first touchpoint gets the least credit, with each subsequent interaction gaining incrementally more credit until you hit conversion (the most credit).
Position-based — Also known as "U-Shaped," this model places 40% of the credit at the initial touchpoint and 40% at the final touchpoint prior to conversion. The remaining 20% of credit is spread evenly across the middle interactions.
Attribution Beta
The new Attribution Beta tool, accessible near the bottom of the navigation menu in Analytics, supports data-driven attribution in addition to the other attribution models available in MCF. Data-driven attribution uses your company’s actual data to create a custom attribution model that is unique to your brand and audience. However, to create the data-driven attribution model, Google needs to collect data from at least 600 site conversions in a 30-day period. Here is a side-by-side comparison of MCF and the new Attribution Beta from Google Support.
Google Analytics 360
For the larger enterprise, Google Analytics 360 delivers advanced attribution modeling in addition to other advanced analytics functions for the hefty cost of $150,000 per year. This product is intended to provide a holistic view of marketing efforts through a more seamless experience that limits the need for third-party solutions. There are six products currently included in Analytics 360 that aim to connect data across platforms, channels, and devices:
- Google Analytics 360
- Google Optimize 360
- Google Audience Center 360
- Google Tag Manager 360
- Google Data Studio 360
- Google Attribution 360
Analytics 360 also provides additional integration options, including Salesforce, BigQuery, AdManager, Display & Video 360, Search Ads 360, Campaign Manager, and Search Console. Other enhancements include advanced customizable funnel reporting and data-driven attribution modeling. But, at a price that excludes most small and medium-sized businesses.
Limitations of Google Analytics
As a free tool, Google Analytics provides a helpful first step toward understanding your customer journey and evaluating how each channel contributes to conversions on your site. However, there are three major limitations.
Excludes impressions — Google Analytics does not include ad impressions as events in its attribution analysis, even with Google Ads integration. Given that most advertising campaigns have far more impressions than clicks, excluding impressions means its attribution models ignore crucial interactions in the very early stage of the customer journey.
Fails to ingest cost data — It does not ingest cost information from ad campaigns, so you cannot evaluate and compare ROI across marketing channels.
Lacks integration — Google Analytics does not integrate with any platform other than Google Ads.
To overcome these serious limitations, marketing teams need to invest in services beyond Google Analytics. Enter, SaaS solutions like AdRoll.
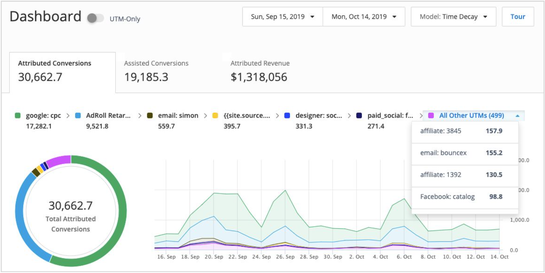
AdRoll Cross-Channel Attribution
AdRoll provides a unified platform that integrates all of the components of your marketing efforts into one, user-friendly tool. It’s artificial intelligence (AI) and machine learning technology automates much of the analytics, reporting, and refinement process, which lifts the burden from the shoulders of marketing teams. Because so much of this work is done without the need for human hours, it’s an excellent solution for companies of all sizes. Small and medium-sized businesses can save significant money and resources by not assigning people to these tasks, and refocusing the marketing team’s efforts toward more creative projects.
Cross-channel attribution
AdRoll's Cross-Channel Attribution stands out from Google Analytics' Multi-Channel Funnels report because of its integrated dashboard, which helps marketers understand the cross-channel customer experience. This provides a clear view into the entire path to purchase, so it’s easy to visualize critical touchpoints and their impact on overall conversions and sales.
![google analytics attribution image]()
Take the Next Step With Attribution
Ultimately, there are terrific attribution tools available to marketing teams and brands of all sizes. From free tools in Google Analytics and AdRoll to more robust paid solutions, every marketer can realize the benefits of attribution. Which option you choose depends on the budget that your company has available and the complexity of your marketing efforts.
Learn more about how AdRoll can help you better manage your marketing data.
Last updated on April 23rd, 2025.